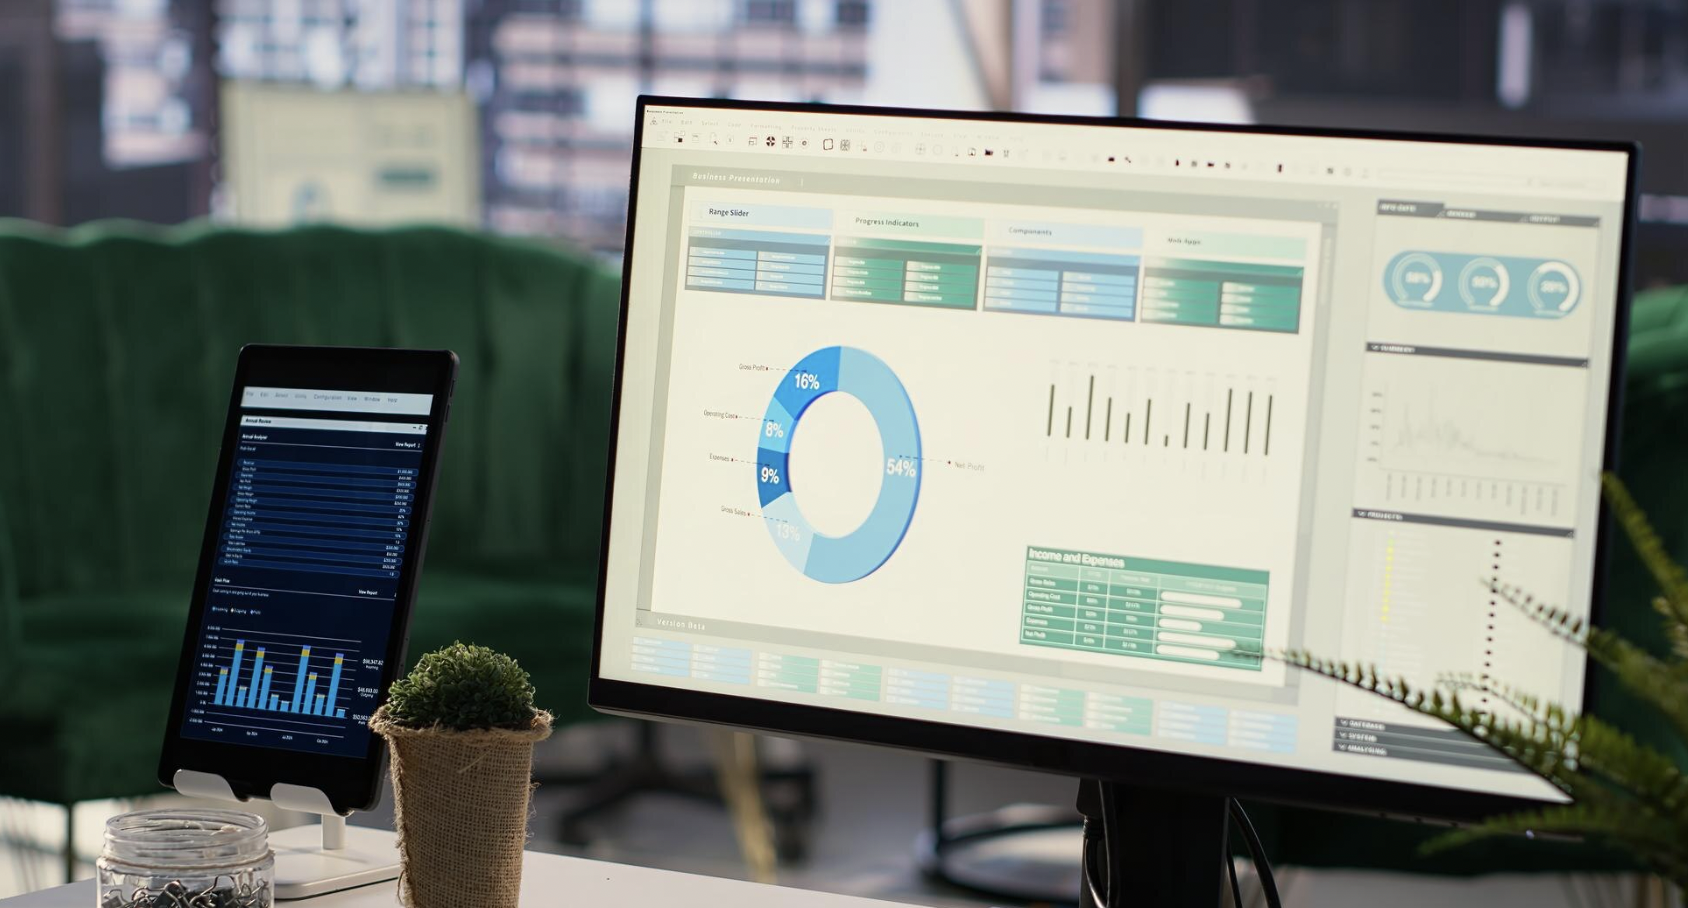
| A hosting dashboard is an interface that aggregates significant features into metrics and visualisations. It consolidates KPIs, exposes role-based actions, and allows non-technical users to explore data without code. Let us learn how dashboard analytics drive data-driven growth —and why organisations still ignore it. |
If you run a website or app, your hosting dashboard is quietly measuring the conditions that influence customer trust.
This includes metrics such as time-to-first-byte, error spikes at checkout, SSL expiry warnings, and bot traffic surges, among others. They capture speed, stability, reliability, and security events before those signals ever show up in analytics tools or sales reports. These statistics indicate customer satisfaction.
However, hosting dashboards is the most underutilised source of customer insights. It is anticipated that most SMBs will be moving workloads to the cloud. Thus, turning dashboard analytics into decisions can lead to data-driven growth. Let us learn more about hosting dashboards in this guide!
What are Hosting Dashboards?
The hosting dashboard is a mechanism for measuring and recording customer experience. It helps aggregate live signals from the web infrastructure and application layers into visual, interactive KPIs.
The best dashboards drill into spikes, automate actions such as scaling or backups, and maintain a comprehensive audit log with role-based approvals.
How Do Hosting Dashboards Work?
Here are some ways in which hosting dashboards transform raw hosting data into customer-level insights and data-driven growth:
1. KPIs of Real-Time Performance
Businesses can use dashboard analytics to assess and work on KPIs like:
- Live views of TTFB
- Median and p95 response times
- Throughput
- Cache hit ratio
- Error rates are mapped directly to Google’s page experience guidance and Core Web Vitals targets.
2. Resource Utilisation and Autoscaling
The hosting dashboard provides recommendations for CPU, memory, and I/O. It helps scale container limits to prevent slowdowns during campaigns, before errors occur in carts or forms.
Furthermore, dashboards alert businesses to issues that can incur costs of tens of thousands per incident, including brute-force attempts, WAF blocks, bot rates, patch status, and TLS/SSL expiry warnings.
Teams can act quickly, even with natural-language actions in newer dashboards, thanks to role-based access, MFA prompts for high-risk actions, and complete audit logs, which create accountability.
3. Error Intelligence
Dashboard analytics help businesses assess the top failing endpoints related to timeouts and dependency errors. This helps them understand how a code push or plugin update affects customers in real time.
4. Self-Service for Non-Technical Teams
Using hosting dashboards, non-technical teams can track backups, run restore tests, view TLS versions, manage PHP/Node runtimes, and receive end-of-life notices.
5. Compliance Hygiene
Businesses can ensure compliance with dashboard analytics that help:
- Track backups
- Restore tests, TLS versions, PHP/Node runtimes, and end-of-life notices.
These features avoid outages during sales or business peaks.
| Also Read: Metrics You Should See in Domain & Hosting Security Dashboards |
How Dashboard Analytics Encourage Data-Driven Growth
Here are some ways in which hosting dashboards ensures data-driven growth:
1. Enhance Speed to Market
Dashboard analytics can improve load times, thereby increasing conversions. Research shows a 2% increase in conversion rate after a 1-second reduction in page load time, along with measurable revenue gains from faster pages. These are signals you can track on your dashboard.
2. Uptime is Revenue Growth
Issues such as business email compromise, fraud, and ransomware pose significant threats to business revenue and consumer trust. Hosting dashboards surface WAF blocks, bot surges, and TLS hygiene issues so you can address them before customers feel the impact.
3. Quality of Traffic
Dashboards help businesses save money by distinguishing between human and bot traffic. Leaders can decide to pause, fix, or scale operations based on signals related to paid clicks, high error rates, or slow TTFB.
4. Self-Service Analytics
Self-service dashboard analytics empower non-technical teams to explore data themselves rather than wait for an analyst.
That means if product and marketing leads can drill into a spike themselves, businesses can reduce the distance between problems and fixes.
5. Assess the Cause-Effect Line
Hosting dashboards helps leaders understand cause-and-effect relationships by overlaying deploys, plugin updates, or DNS/SSL changes on performance charts. That feature helps them make informed and data-driven decisions.
6. Measure Capacity Insights
Here are different capacity-related ways in which hosting dashboards enhances data-driven growth:
- CPU, memory, and I/O tiles, along with auto-scaling recommendations.
- Dashboards flag EOL run times, missed backups, or upcoming TLS expirations, and ensure negligible slowdowns during sales.
These are risk dashboards that help identify and resolve incidents more effectively.
| Also Read: Local SEO Tools Integrated Into Hosting Dashboards for Aussie Businesses |
Why are Hosting Dashboards Underutilised?
The fact that dashboard analytics enable data-driven growth is often underestimated and underutilised by many organisations. Here are the reasons:
- Too Many Tools and No Single View – Marketing sees analytics, devs see logs, and support sees tickets. However, nobody correlates those signals. A hosting dashboard helps in unifying these signals.
- The Fear of Security Lapses – Teams switch off the alerts after a noisy week and miss the one that mattered. However, the cost of ignoring these lapses can be higher than the cost of properly tuning dashboard analytics alerts.
- No Direct Relation with Business ROI – Businesses believe that if the team’s revenue or lead targets aren’t tied to concrete thresholds, dashboards won’t drive action. Dashboards answer questions, not just show charts.
- Dashboards are meant for Technical Teams – This is another reason why hosting dashboards is underutilised. Many teams still assume dashboards are operational, not commercial, so sales and marketing don’t log in.
Best Practices to Incorporate Hosting Dashboards
Here are some tips that you must follow to integrate hosting dashboards within your existing web infrastructure:
1. Switch from Charts to Integral Facts
Instead of relying on interactive and multimedia-related information, you consider whether the business is:
- Is the meeting ‘good’ for Core Web Vitals on top revenue pages
- Is changing in any way that customers could feel
- It is affecting human traffic, especially during campaigns
All these data-driven facts can be measured using hosting dashboards, which can help you pin the tiles and alerts about such questions first.
2. Assign Ownership of Tiles
Assign a human owner to every critical KPI, such as uptime, p95 response time, error rate, or WAF blocks. Owners are responsible for escalating when thresholds are breached. This leads to the responsibility for actions.
3. Annotate Everything
Add annotations to deployment, updates of plugins, DNS changes, content releases, and even sales promos so that you can point to a specific change for a dip in conversions.
4. Link Thresholds with Revenue
Estimate your downtime and slowdown costs using published benchmarks to build a sense of urgency. Empower products and support to explore dashboard analytics themselves without filing a data ticket. Document two or three common explorations, and you’ll see adoption jump.
5. Routine Maintenance
Secure analytics by design, close the loop with incidents and learning, and run quarterly checks for runtime EOL, unused plugins, TLS expiry windows, and restore tests. This routine maintenance is the cheapest reliability you’ll ever buy.
Hosting Dashboards – The Most Honest Record of What Customers Feel Today
Make hosting dashboards the very first screen you see every morning. Tie thresholds to tangible outcomes, operationalise dashboard analytics and ensure data-driven growth in your venture.
Find a provider with reliable uptime, intuitive front-end dashboards, and local in-country support so non-technical teams can confidently explore.
Start with Crazy Domains for an easy on-ramp to a cleaner and more actionable dashboard experience. Turn your infrastructure signals into everyday wins.